
Social media has become an important tool in marketing. It enables us to connect with our customers, providing real insights into their behavior. This allows us to create content that is tailored to target audience interests.
A good social media strategy requires planning, collaboration and consistency, but ultimately is designed for optimal engagement. So how do you track social media analytics?
Installing The Google Site Tag on Your Website
When you install this analytics tracking code on your website, it gives you the ability to track website visitors. Without this code, it’s impossible to capture any data.
First, select Admin from the left-hand menu options.

Then, locate the “Property” column in the center and click “Tracking Info.”

Selecting that option will give you a drop-down menu. You’re looking for the “Tracking Code” to add to your website.

This code is the Global site tag you’ll install in the <head> section of every page of your website. And yes, it does have to be installed on every page you want to track.

There are a number of different ways to install this code—many people use a plugin, like these examples for WordPress, or install the code manually to the headers section of your website.
Theme header installation via Monster Insights
Just make sure you’re 100% comfortable with your coding abilities before moving forward with this route.
The Google Site Tag should be the very last thing that’s in the <head> section of your website.
Google Site Tag installed in the header section of WordPress via MonsterInsights
And there you have it!
Once the code is installed on your website, you’ll be able to start collecting a lot of data about your visitors.
Now you just have to set up your team so they can access this data as well.
Traffic by social channel
See your most valuable networks, plus the up-and-comers

Where to find this report:
Acquisition > Social > Network Referrals
What this report tells you:
At-a-glance, you can see which social network sends you the most visits to your website. For instance, Twitter sent the Buffer blog 79,096 visitors last month.
You can view the data in a pie chart to see how the networks break down as an overall percentage of social traffic to your site. For instance, Twitter accounted for 56 percent of social traffic to the Buffer blog. Twitter and Facebook combined accounted for 81 percent.
You can expand the results to show 25 or 50 channels, then change the date range to include a comparison to last period. Voila! Now you can identify networks beyond your main ones that are beginning to send you more and more traffic. For the Buffer blog, we’ve noticed StumbleUpon and Hacker News seem to be on the rise.
Advanced:
If you click on the individual network name in this report, you can see a breakdown of all the links of yours that have been shared on that network.

Creating Admins Who Can Access Google Analytics Data
Google Analytics has four permissions levels, each with different abilities. Setting the appropriate permissions for your team helps make it easy for everyone to accomplish their individual tasks as well as collaborate effectively.
When you’re giving access to your team, think about which employees need access to this data, either with or without your help. Just make sure you’re not giving too many people edit access; too many people making changes can get confusing.
To set these permission levels, select the Admin menu.
Then, “User Management.”

From here, you will have four permissions levels to choose from:
- Manage Users: This grants permission to decide how others can make changes to your Google Analytics account. Reserve it for a select few people in your leadership team.
- Edit: An administrative level of permission. Users can create properties, views, filters, goals, etc. It’s a great option for strategy-focused members of your team.
- Collaborate: Collaborators can create and manage personal assets within Google Analytics, but are unable to make changes on an administrative level.
- Read & Analyze: The lowest level of permissions. Use it for employees who are just getting started with Google Analytics and don’t need to actively use the service on a daily basis.
Your advertising managers will likely require Edit access to Google Analytics, as will some members of their team.
Everyone else can be set to Collaborate or Read & Analyze so they can easily check in on the insights you find.
Now, with all the boring admin stuff out of the way, let’s take a look at how you can start creating goals, dashboards, and reports to track specific information.
Social media traffic
See how much social media contributes to your overall visits

Where to find this report:
Acquisition > All Traffic > Channels
What this report tells you:
You can see your traffic sources at a high-level:
- Organic search (people clicking through from Google)
- Social (Twitter, Facebook, social visits)
- Direct (people typing your site in their browser or bookmarks)
- Referral (people clicking links from other sites to get to you)
- Paid search
- Other
With this info, you get a great sense of the importance of social media for bringing people to your site. If you ever need justification for focusing on social media, this report is it!
For the Buffer blog, we see 15 percent of our traffic from social, which accounts for nearly 150,000 visits each month.
Advanced:
Under the Acquisition > All Traffic category, you can click to view the Source/Medium, which will show you a granular break down of the search, social, and referral traffic. For a quick hack into your mobile vs. desktop traffic, look at how each social network URL is abbreviated. Twitter on mobile is represented by t.co, and desktop is twitter.com. Facebook on mobile is represented by m.facebook.com, and desktop is facebook.com.
In addition, to see the mobile vs. desktop traffic breakdown, you can add a Secondary Dimension to any view (by clicking the Secondary Dimension button at the top of any table). Type in “Mobile” and select “Mobile (Including Tablet).”
Creating Goals to Track Specifics
Goals are how you track specific actions a visitor takes while on your website.
Creating specific goals for your social media ads is the best way to track your ROI. Without these goals, you’ll never know how much of an impact your efforts truly make.
Start again in the Admin section of your Google Analytics account, then select “Goals” from the “View” options.

This will bring up a list of your current goals and give you the option to create new ones.

Creating a new goal starts by defining your ad’s objective. Google offers goal templates to simplify this process for you.

Templates are broken down into five different types:
- Revenue: Goals that are tied directly to when a user makes a purchase through your online store.
- Acquisition: Goals that are based on getting new leads into your funnel, like those who sign up for a newsletter about your product.
- Inquiry: Goals that have something to do with people requesting more information about your business. This could be filling out your contact page, or clicking a “Request more info” CTA on one of your ads.
- Engagement: Goals based on how someone interacts with your site. Whether that’s downloading an ebook or watching a product video.
- Custom: Anything you want them to be!
The goals you set influence what kind of data you’ll gather on visitors in Google Analytics.
Landing pages

Where to find this report:
Acquisition > Social > Landing Pages
What this report tells you:
Use this report to see your website pages that get shared most often on social media. For the Buffer blog in the past 30 days, our most-shared story is Andrianes Pinantoan’s guest post about Canva’s growth strategy.
Advanced:
You can click any link in this report to see the specific breakdown of networks where this content was shared.
Building Dashboards and Reports for Quick Analysis
To track how well your ads are meeting your objectives, you can create Dashboards in Analytics.
These bring together specific elements of your Google Analytics account into a single view for easy analysis.

You can create these dashboards under the “Customization” drop-down menu by selecting “Dashboards.”

Then, click “Create.”

You’ll be prompted to give your dashboard a name and select whether or not you want to start with a “Blank Canvas” or a “Starter Dashboard.”
If this is your first time creating a dashboard, we suggest selecting the latter.

From here, you can add widgets, elements on the dashboard that highlight a single metric you want to track.

Here what it looks like when you add a widget:

Let’s break these widgets down for you!
- Widget type:
Select from Standard or Real-time widgets to define how you want the data to appear on your dashboard.
- Metric:
Choose the main dimension you want to track in this widget.
- Filters:
Segment your data further by additional factors.
Once that’s all set, it will look something like this:

In this example, we want to see how mobile traffic converts on various landing pages.
We created this widget to display as a Table (1) with columns comparing Landing Pages and Goal Conversion Rate (2). To refine the search more, we also created a filter to show only new traffic coming from mobile devices (3).
Combine these dashboards with custom reports and you can tailor your Google Analytics account to display only the most valuable data for any campaign.
To create these reports, first select “Custom Reports” from within the “Customization” drop-down in your left-hand menu.

Then, click the “New Custom Report” button.

To create your personalized report dashboard, you need to set a number of specific parameters.

Google provides a lot of useful information on how to structure these reports, but it basically comes down to four things:
- The type of report you want to create,
- the dimensions and metrics you want to track,
- any filters you want to apply, and
- the specific Google Analytics views where the report is accessible.
Once you create the report, you’ll be able to access and manage it directly in the “Custom Reports” section of your account.

Google Analytics is definitely one of the most comprehensive analytics tools around and it’s hard to narrow down what’s really important.
When you use custom reports and dashboards to display specific information and create goals that help you track your ad performance, it helps narrow down the data into exactly what you need.
Now that we have the “how” under control—let’s take a look at the why!
As we’ve seen, there’s a lot of different ways to look at your Google Analytics data, making sense of it all for your social media reporting is the next step.
Multi-channel reports

Where to find this report:
Conversions > Multi-Channel Funnels > Overview
This report will work if you’ve got Goals set up for your website. (See below.)
What this report tells you:
The Venn diagram you’ll get on this report page shows the various paths that people take to convert through your website or blog. For example, on the Buffer blog, a good majority of people convert after coming to the site from organic search. A smaller—but still significant—portion convert after coming directly or clicking on a link from social media.
The overlap in the Venn diagrams represent visitors who might, for instance, click a link in a tweet first, then come back to the site directly later on to go through the conversion flow. And Google Analytics tracks all this, all the way through!
Advanced:
Further down into the Multi-Channel Funnels, there are some neat reports:
- Top Conversion Paths
- Time Lag
- Page Length
For Top Conversion Paths, you can see the frequency with which visitors take certain routes to conversion. For instance, I can see in my report that the most common path is a person visiting my site directly two times before converting. The top social path is a visit or two from social first, then a direct visit.BROUGHT TO YOU BY
Publish Flawlessly. Analyze Effortlessly. Engage Authentically.
Buffer is the all-you-need social media toolkit that lets you focus on doing what you love for your business.Get started for free now
You can change the view here also by clicking on “Source/Medium Path” at the top of the chart to see the specific social networks involved in the conversion flow.

For Time Lag, you can see how many days come between first visit and conversion.
For Path Length, you can see a breakdown of how many paths are involved in each conversion typically. For my blog, the vast majority (75%) convert after one visit.
Create Your Own UTMs With the UTM Builder Tool
The good news is that there’s an easier way to create UTMs for your campaigns. The UTM Builder tracking tool will keep your UTMs structured and ensure all of your information is organized and in one place.
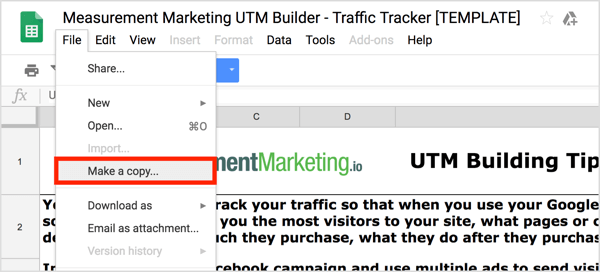
To use this method, open the UTM Builder and then choose File > Make a Copy to create your own copy so you’ll be able to edit it.
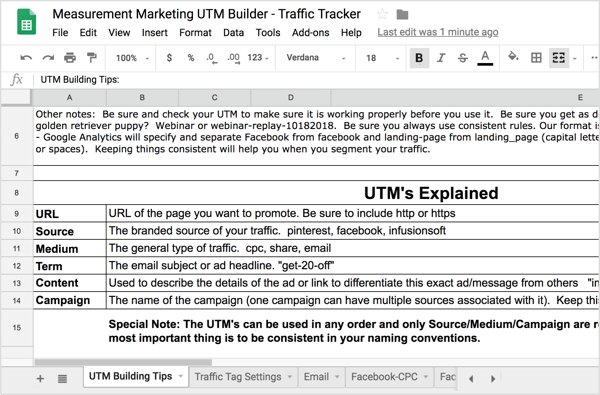
On the first tab, UTM Building Tips, you’ll find a recap of the UTM information discussed earlier.
To start customizing this sheet, open the Traffic Tag Settings tab to set up your core traffic tag settings. In the Source column, list the “brands” of traffic sources you use (Facebook, YouTube, etc.). In the Medium column, add the types of traffic you use (share, CPC, email, etc.). In the Campaign column, list the products or services you offer.
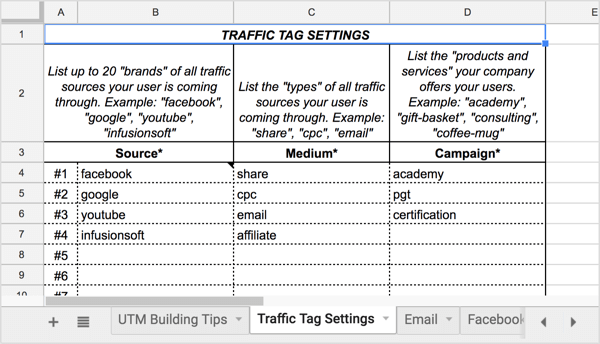
The sources, mediums, and campaigns you list on this tab will show up in drop-down lists on the other tabs of this sheet, as you’ll see in a second.
Once you’ve filled in that information, you’re ready to start creating your UTMs. To understand how to use this tracking tool, let’s use it to create the UTM for the Facebook ad example from earlier. Start by opening the Facebook-CPC tab.
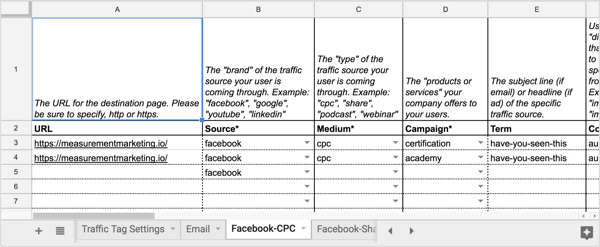
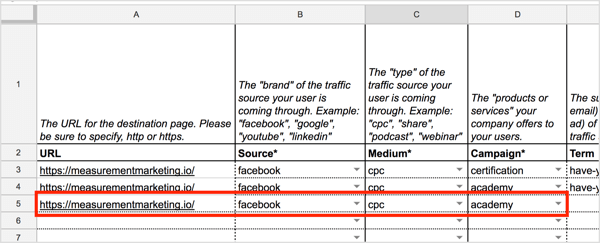
In the URL column on this tab, type in the URL for the ad’s landing page. Then in the Source column, select the social media traffic source (Facebook, in this case) from the drop-down list.
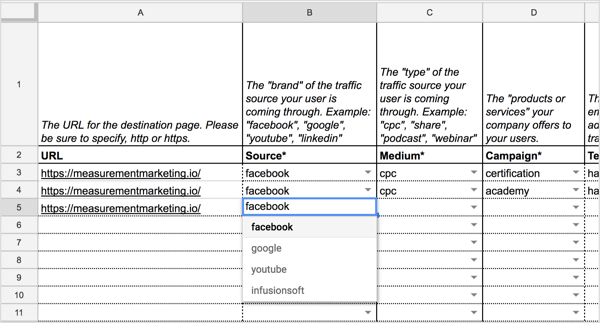
In the Medium and Campaign columns, select the medium (CPC) and campaign (academy) from the drop-down lists.
Here’s what your sheet looks like at this point:
Next, type in your term and add the details about your content.
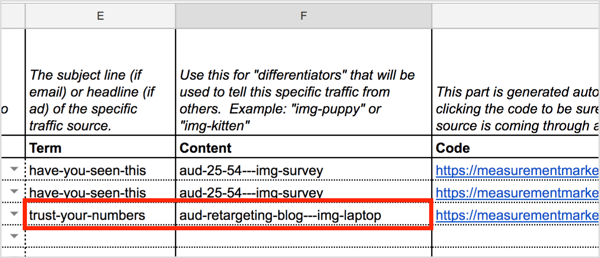
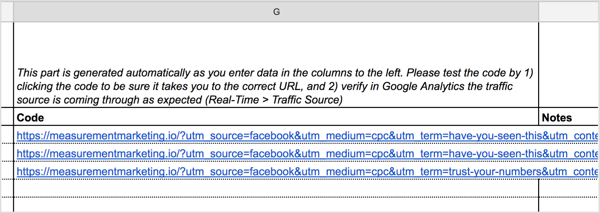
As you define the different parameters, the spreadsheet will automatically generate the URL for you in the Code column. Click the code in the spreadsheet to test it and make sure it opens to the correct landing page.
Tip: As you add UTMs to your spreadsheet and begin tracking, you may want to highlight the content and campaigns that bring you the most social media traffic. Keeping them in this spreadsheet will help you remember specific details you may need to know later on.
UTM campaign results

Where to find this report:
Acquisition > Campaigns
What this report tells you:
If you’re running a social media campaign, you can append the URLs you’re sharing with a UTM parameter, a bit of text that goes at the end of your link. Google’s free URL Builder is perhaps the simplest way to set these up.
If we were running a campaign for a bufferchat, we could change this link:
https://buffer.com/library/free-marketing-tools
to this:
https://buffer.com/library/free-marketing-tools?utm_source=twitter&utm_medium=tweet&utm_campaign=bufferchat
When setting up the new URL in Google’s URL Builder, just make note of what you’re calling the “Campaign Name,” as this is how you’ll find the results in your Google Analytics reports.
The value here is that you’ll then be able to track how many visits this campaign sent back to your website as well as what happened to these visitors once they landed. How long did they stay? Did they convert? Etc.
Advanced:
Within the Campaigns report, you might notice the term “buffer” popping up. When you share a link from Buffer, we automatically add a UTM parameter to the shortened URL so you can easily track the impact of your social sharing via Buffer. You can override these campaign settings by creating custom UTMs in your Buffer dashboard.
Have you ever noticed in Google Analytics, in particular in the social tab, that your numbers are very low? Are you running a test on your site and noticed your numbers are half of what they normally are? If you answered yes to either of these questions then this post is for you to track your social media analytics for your website using UTM parameters.