
Social Media Success Metrics provides businesses with the metrics that indicate interest. This package is designed to assist in monitoring social media activity and how that activity affects sales.
Social Media Success Metrics helps you evaluate your social media efforts by providing actionable social media metrics dashboards. The dashboard provides the most important social media metrics including unique visitors, daily traffic, new followers, engagement rate, daily time on site and bounce rate.
Volume
The first – and easiest – social media metric to measure is volume. What is the size of the conversation about your brand or your campaign? Volume is a great initial indicator of interest. People tend to talk about things they either love or hate, but they rarely talk about things they simply don’t care about at all.
While volume can seem like a simple counting metric, there’s more to it than just counting tweets and wall posts. It’s important to measure the number of messages about your brand, as well as the number of people talking about your brand, and track how both of those numbers change over time. For example, Facebook Insights has a useful metric (cleverly called “people talking about this”) that measures how many unique people have posted something to their walls about your brand page.

Learn when volume is higher – are there days or times when more people seem to be talking about your brand? You can use this information to focus more of your own posts during these times to get more engagement, which we’ll talk about in a minute.
Reach

Reach measures the spread of a social media conversation. On its own, reach can help you understand the context for your content. How far is your content disseminating and how big is the audience for your message? Reach is a measure of potential audience size.
And of course, a large audience is good, but reach alone does not tell you everything. Reach becomes very powerful when compared to other engagement metrics. Use reach as the denominator in your social media measurement equations.
Pick important action or engagement numbers like clicks, retweets, or replies (more on this in a second) and divide them by reach to calculate an engagement percentage. Of the possible audience for your campaign, how many people participated? Reach helps contextualize other engagement metrics.
Engagement
Speaking of engagement metrics, this is one of the most important areas to measure in social media. How are people participating in the conversation about your brand? What are they doing to spread your content and engage with the topic?
In most social media settings, content can be both shared and replied to. Twitter retweets (RTs) and Facebook shares and posts are helpful to know who is spreading your content, while comments, replies and likes are helpful to see who is replying to your content. Think carefully about your goals with social media. Are you focused more on generating interaction (replies, comments) or on spreading a message (retweets and posts)? Be sure you’re using metrics that reflect what’s important to your brand right now.

And are there types of content that generate engagement? Start paying attention to what messages generate the most replies and RTs. It might surprise you what people interact with; it’s not always what you expect.
Reach KPIs
Reach KPIs measure how many users come across your social channels. These users might only interact with the channel passively — reach and engagement are two different things. Think of reach as a quantity measurement — reach data demonstrates your existing and potential audience, growth over time and brand awareness.
Impressions
This is the number of times your post was visible in someone’s feed or timeline. This doesn’t necessarily mean the person who viewed the post noticed it or read it.
Follower count
The number of followers your social channel has at a set time.
Audience growth rate
You want to make sure you’re gaining followers, not losing them. Audience growth rate demonstrates how follower count is changing over time.
Here’s a simple formula for tracking it:

Social share of voice
This metric tracks how many people mentioned your brand, compared to the number of people mentioning your competitors. Simply, it shows how relevant your brand is within your industry. You can use a social listening tool like Hootsuite to measure your own and your competitors’ mentions during a specific timeframe.
Here’s how to calculate social share of voice:

Track Likes and Reactions for Your Posts
Gauging how your audience reacts to the content you post and share is crucial for any marketing strategy. This direct response metric helps you determine whether your audience is interested in what you’re currently publishing, and should inform the type of content you share in the future.
If your only engagement is chirping crickets on certain topics, cut that content from your editorial calendar or send those articles through another channel to a different audience segment that might be more receptive.
Facebook provides more in-depth measurements with its updated reaction system, which lets you know whether your fans like, love, dislike, or are upset by something you shared.
To find this information, go to your Insights page and click the Posts option in the left navigation. Then scroll down to All Posts Published and click on the right drop-down arrow to view Reactions, Comments, and Shares.
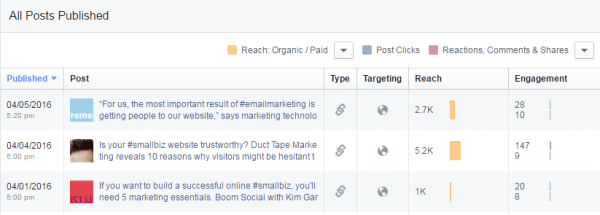
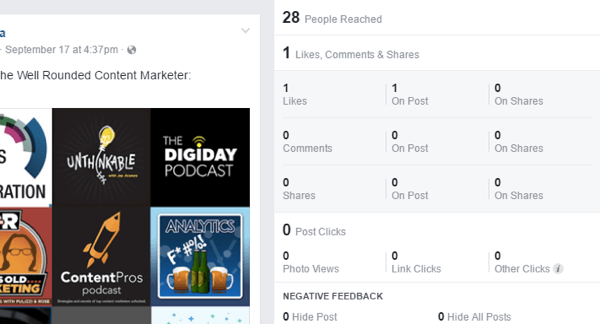
The data in the Engagement column measures the total reactions for a post. If you want to see a more detailed look at a post’s performance, click on the post link to view the breakdown of reactions from your audience.
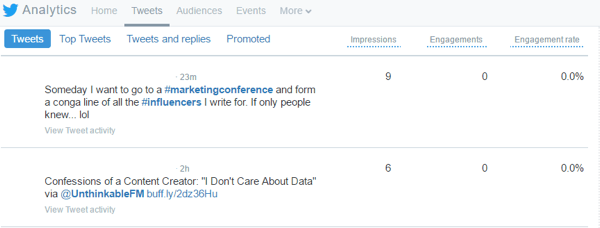
Twitter has a similar approach and displays all of your tweets for a selected timeframe. To find this data in your analytics, click the Tweets tab at the top and scroll down to view your tweets. You can also click Top Tweets to view only your most popular tweets.
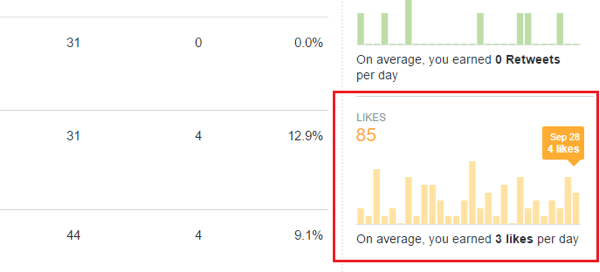
The Engagements column on the right is helpful, but it includes a lot of extra information (basically any interaction with the tweet). If you’re just looking for likes for a particular post, scroll through the graphs on the right until you see Likes. This data shows the daily number of likes that your tweets are receiving, as well as your average likes per day.
Conclusion
Social Media Success Metrics provides you with clear visualized data which will help you successfully manage and grow your social media presence.