Are you trying to find the best business intelligence software? Are you looking for the best open source business intelligence software? Before, there was one or two products in this space. But now, there are dozens of quality options to choose from. So, how do you choose a product? You should consider functionality, customizability, and pricing — all based on your specific requirements.
I know how to set up a business intelligence software or enterprise business intelligence software. But maybe you don’t really need a full-blown, enterprise solution. Maybe all you need is a little BI application, or something to manage your data. What are the best free business intelligence software programs? These are some of the best business intelligence software with open source data visualization frameworks that you can use right now.
Board
Board International combines three tools in one: BI, predictive analytics and performance management. While it aims to offer something for everyone, it predominately focuses on finance-oriented BI. It has modules for finance (planning, consolidation), HR (skills mapping, workforce planning), marketing (social media analysis, loyalty and retention monitoring), supply chain (delivery optimization, supplier management), sales (cross-selling and up-selling analysis) and IT (KPIs, service levels). The company is Swiss, but the software is available in English, Spanish, Chinese, Japanese, French, German and Italian. The latest version of its platform has replaced its multidimensional online analytical processing (MOLAP) approach with an in-memory calculation engine.
- Target audience: The whole enterprise but usually enters via the finance department
- Notable features: Language support
- Pricing: License fee per user varies according to role
Domo
Domo is a cloud-based platform focused on business-user-deployed dashboards and ease-of-use. It offers business intelligence tools tailored to various industries (such as financial services, health care, manufacturing and education) and roles (including CEOs, sales, BI professionals and IT workers). CIOs might start by checking out how it handles data from AWS, Jira, GitHub, or New Relic before looking at how over 500 other integrations can help the rest of the enterprise.
- Target audience: CEOs, sales and marketing, BI professionals
- Notable features: Robust mobile interface
- Pricing: On request
Dundas BI
Dundas BI from Dundas Data Visualization is used predominantly for creating dashboards and scorecards, the company’s historic strengths, but it can also perform standard and ad-hoc reporting. Analysis and visualization are performed through a web interface that can adapt to users’ skills: Power users and standard users see different features. The latest version has a new in-memory engine, a new natural language query capability, and adds point-and-click trend analysis, support for Linux, and an application development environment for customized analytic applications. Dundas BI has been tailored for 19 industries, including clean tech, mining and construction, in addition to the usual suspects such as banking and healthcare. It sells to large enterprises but specializes in embedded BI.
- Target audience: C-suite, HR, finance, sales, marketing, customer service
- Notable features: Flexible, HTML5 interface that adapts to any device
- Pricing: Based on concurrent users, not named users, with no tie to number of servers or cores
Microsoft Power BI
With the Power BI Desktop app for Windows, users can analyze and visualize data from local or cloud sources, publishing their reports to the Power BI platform. It offers data preparation, visual-based discovery, interactive dashboards, and augmented analytics. The free Power BI Desktop version suits isolated users; the Pro version makes collaborative analysis easier, for a monthly fee, leveraging Microsoft Office365, SharePoint and Teams to control access to raw data and published reports. For enterprises that want to go all-in, the Premium tier makes self-service data prep possible with prebuilt connectors to corporate data held in Microsoft Dynamics 365, Azure SQL Data Warehouse, or third-party sources such as Salesforce.
- Target audience: Microsoft shops
- Notable features: Mobile app allows touch-screen annotation of reports
- Pricing: Desktop: free; Pro: $9.99 per user, per month; Premium: $4,995 per dedicated cloud compute and storage resource
MicroStrategy
MicroStrategy targets the enterprise BI market in a broad range of industries with cloud, on-premises and hybrid deployment options. It features a drag-and-drop interface to help users create customized data visualizations and build personalized, real-time dashboards. MicroStrategy touts federated analytics that allow customers to leverage existing investments in data sources such as Tableau, Qlik and Power BI, and blend the data to build reports and insights. It also features enterprise semantics graph, which indexes data assets to enrich data silos with location intelligence and real-time telemetry. MicroStrategy offers a free, 30-day full platform trial.
- Target audience: The whole enterprise
- Notable features: Digital credentials allow you to replace physical ID cards, passwords and tokens in favor of mobile role-based identity badges tied to smartphones
- Pricing: By request
datapine

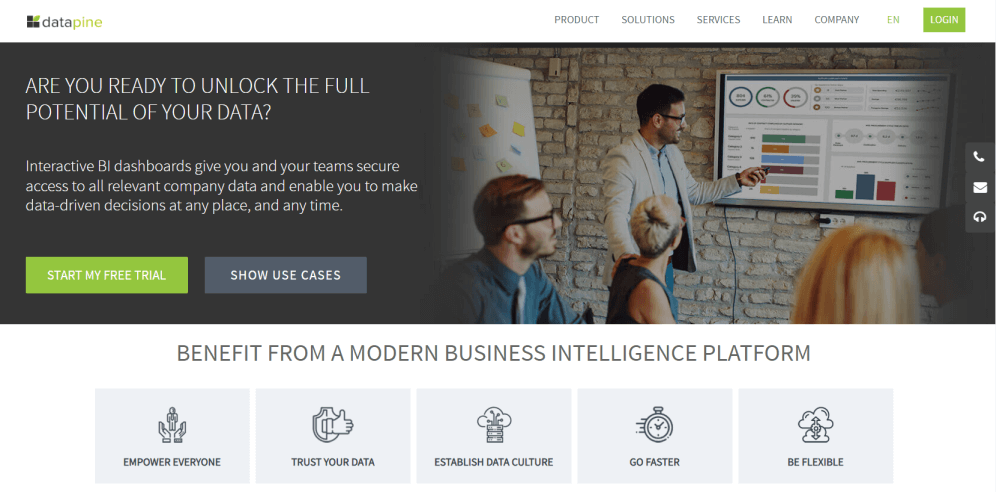
datapine is a BI software that lets you connect your data from various sources and analyze them with advanced features (including predictive analytics and artificial intelligence). With all your data in hand, you can create a powerful business dashboard (or several), generate standard or customized reports, or incorporate intelligent alerts to get notified of anomalies and targets. This tool, rated with outstanding 4.8 stars on Capterra and 4.6 on G2Crowd, is a powerful solution for businesses of all sizes since datapine can be implemented for various industries, functions, and platforms, no matter the size.
The software offers features for both advanced users such as data analysts and average business users. The SQL mode enables analysts to create their own queries while, on the other hand, the intuitive drag-and-drop interface ensures a visually intuitive way of entering your values and creating powerful charts and dashboards, simply by using effective visual analytics.
KEY FEATURES:
Intuitive drag-and-drop interface: Simply drag your KPIs into the interface and see how your charts and graphs transform into a professional dashboard without any IT involvement or advanced coding.
Easy-to-use predictive analytics: Advanced analytics features, including predictive analysis based on a forecast engine, where you simply select the KPI, determine the number of data points you want to forecast, specify the previous data points for the calculation, and finally define the model quality by appointing the desired confidence interval.
Many interactive dashboard features: Dig deep into each part of the dashboard with advanced dashboard software features such as drill-downs, chart zooms, widget linking, hierarchical filters, among others, that will ensure a detailed data discovery process.
Multiple reporting options: Take advantage of BI reporting tools and create standard or customized reports by sharing via password-protected live URL, enabling viewer access, or sending an e-mail report which you can automate at specific time intervals. Additionally, you can embed datapine into your own application and get all the benefits of BI software without spending all the money and resources on one of your own.
Smart insights and alarms based on artificial intelligence: With artificial intelligence, machine learning, and pattern recognition technologies, they alert the user if a business anomaly occurs or generate multiple types of insights, including growth, trends, value drivers, what-if scenarios, among others.
SHORTCOMINGS:
They do offer mobile access, but the dashboards are not directly accessible unless you download their app and customize them within the mobile view.
SAS Business Intelligence

SAS Business Intelligence is a BI tool offering numerous products and technologies for data scientists, text analysts, data engineers, forecasting analysts, econometricians, and optimization modelers, among others. Founded in the 70s, SAS Business Intelligence enjoys a long tradition in the market, building and expanding its products every year. With a Capterra rating of 4.3 and 4.2 in G2Crowd, this software enjoys a decent level of users’ trust and satisfaction.
KEY FEATURES:
5 main subjects: SAS offers different BI products and technologies that are focused on visual data exploration and easy analytics, interactive reporting and dashboards, collaboration, and mobile apps.
Data exploration supported by machine learning: SAS’ data exploration offers automated analysis supported by machine learning compiled in interactive visualizations that answer business questions such as: “Where do my customers come from?”
Text analytics capabilities: Interesting features are text analytics that enables you to gain insights from text data such as social media and location analytics that combines data in a geographical context.
Reports and dashboards across devices: Dynamic visuals are organized into interactive reports and dashboards, similar to other tools in our lists, and you can access them also on mobile and tablet devices (both Android and iOS).
Integration with other applications: You can integrate SAS with Microsoft Office applications such as PowerPoint, Word, SharePoint or Excel with their Office Analytics solution which enables you to view your results directly in Microsoft Office Suite.
SHORTCOMINGS:
Considering the complexity of the product and its offers, the higher price range and limited customization options can be huge factors in deciding if this business intelligence tool would be the right choice, as most users indicate on Capterra and G2crowd.
Tableau Desktop
Strong visuals and real-time analytics
TODAY’S BEST DEALSVISIT SITE
Reasons to buy
+Free trial offer+Slick interface with drag and drop buttons
Reasons to avoid
-ExpensiveAdvertisement
Tableau Desktop endeavors to do more than make charts, but rather to show “live visual analytics.” A slick interface with drag and drop buttons allows the user to quickly be able to spot trends in the data. There is a lengthy list of supported data sources, including Microsoft Excel, Google Analytics, Box and PDF files.
Tableau enjoys the ability to connect with pretty much any type of database, as well as use a whole range of data blending options, to output into an even bigger selection of charts. Dashboard visualizations can be easily shared, and are mobile friendly.
Tableau Desktop becomes an expensive option for a single user, making this more expensive than other competing solutions. On balance, it also includes the associated application of Tableau Prep under the Tableau Creator package.
Zoho Analytics
A tool from folks that have a cloud-based approach in their DNA
TODAY’S BEST DEALSVISIT SITE
Reasons to buy
+Support to collect data from many sources+Visually attractive dashboard+Availability of free trial
Reasons to avoid
-Requires purchase on annual basis
Zoho Analytics is the business intelligence tool from the folks that have plenty of experience with web-based business tools, namely the venerable Zoho Office. Zoho Reports is a robust solution, that can integrate data from a variety of files, including Microsoft Office documents, URL feeds, and databases, such as MySQL, along with applications, of course from Zoho, but also outside their ecosystem including data from the cloud from Box, DropBox, Google Drive and other applications (for example Salesforce, Quickbooks and Google Analytics).
Data can then be blended via integrated mathematical and statistical formulas, for example marketing costs in an Excel file, with sales data in a cloud database, to create a visually attractive and informative report. This is all done via a simple online interface, and functions can be applied via a simple drag and drop, with reports that can be easily viewed via the portal, or also printed or emailed.
Conclusion:
I know how to set up a business intelligence software or enterprise business intelligence software. But maybe you don’t really need a full-blown, enterprise solution. Maybe all you need is a little BI application, or something to manage your data. What are the best free business intelligence software programs? These are some of the best business intelligence software with open source data visualization frameworks that you can use right now.